
1st October 2013 | Hudson Contract
Hudson Contract delivers the most accurate indications of pay trends across the construction industry, using payroll data for over 2,200 construction companies and over 125,000 freelance builders to publish the average pay for the full spectrum of 17 different trades across five regions.
First of all, the short-term trend: Earnings in four of our five regions have increased for the fourth month in succession – but it’s a very different story in the South-West, where freelance builders show a significant 5.25% decrease over the past twelve weeks.
By contrast, earnings in the Midlands have jumped by 5.5%, followed by the North-East and North-West with increases of just over 2% and the South-East staying all but level at 0.16%.
Individual Winners...
- Roofers in the Midlands: +20%
- Joiners in the North-West: +17%
- Plumbers in the Midlands: +16%
...and Losers
- Electricians in the South-West: -16%
- Roofers in the South-East: -16%
- Specialist trades in the South-West: -15%
Longer-term: Hudson Contract Managing Director David Jackson comments: “The mood across the industry is one of optimism. House building continues to pick up, and the latest figures from the Office For National Statistics reveal overall construction output is 4% up on the year – which is the best it has been since December 2011.
“And there’s further good news in that the rate at which construction companies are going insolvent is finally slowing down; Experian reports that this has been the tenth successive month of numbers falling, year on year.
Freelance bricklayer shortage in Yorkshire
“I have also been told by the site manager of a Yorkshire construction firm that over the past nine months, the rates per thousand bricks have increased from £300 to £480 per thousand – and that there is a shortage of freelance bricklaying gangs for future work. Since bricklayers are the barometer of activity in construction, this reflects the additional number of projects that are getting off the ground, along with the need for firms to be able to operate with a flexible freelance workforce.
Nationwide, we are also seeing an increase in the number of large payments being made to freelance builders, which is a further indication that demand for resource is picking up. The majority of operatives are on fixed price work and are willing to put in long hours to get the job done and onto the next project and/or contractor.
“On a more cautious note however, cashflow continues to be an issue for many firms, because increased workloads mean increased costs – and obtaining credit is still a hurdle for many small and medium firms.”
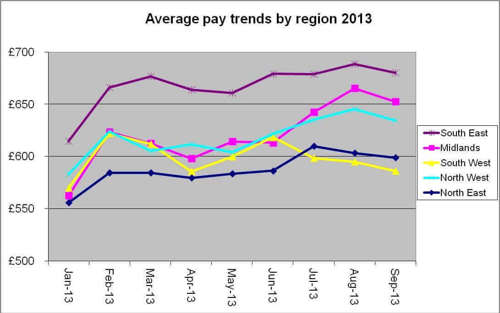
As our chart shows, freelance builders everywhere are
earning more now than they were at the start of the year.
As for this month’s ‘poor relation’, the South-West: Earnings here peaked in June, with a weekly average across all trades rising to £618, compared to £586 in September. For the other regions, however, this peak came later – in July for the North-East and in August for the Midlands, South- East and North-West. Says David Jackson: “Hopefully this downturn was purely due to our great summer and autumn will bring bright and sunny earnings once again and to all regions.”
NORTH EAST
| Last Month | 3 months ago | % change | |
| Bricklaying | £565.01 | £539.51 | 4.73% |
| Civil Engineering | £595.82 | £581.17 | 2.52% |
| Demolition | £465.91 | £405.78 | 14.82% |
| Electrical | £688.57 | £635.83 | 8.29% |
| Equipment & Operator hire | £622.79 | £640.76 | -2.80% |
| Fit out by specialist trades | £678.23 | £624.33 | 8.63% |
| General Construction | £591.60 | £563.30 | 5.02% |
| Insulation | £648.25 | £627.84 | 3.25% |
| Joinery | £607.85 | £584.34 | 4.02% |
| Mechanical | £726.89 | £642.08 | 13.21% |
| Plastering | £648.12 | £684.65 | -5.34% |
| Plumbing | £617.03 | £626.05 | -1.44% |
| Roofing | £561.96 | £528.38 | 6.36% |
| Scaffolding | £454.14 | £449.18 | 1.10% |
| Shopfitting | £538.99 | £628.82 | -14.29% |
| Steel & Timber frame erect | £647.04 | £665.03 | -2.71% |
| Surfacing contractors | £522.25 | £540.99 | -3.46% |
| Average | £598.85 | £586.36 | 2.13% |
NORTH WEST
| Last Month | 3 months ago | % change | |
| Bricklaying | £518.20 | £ 476.16 | 8.83% |
| Civil Engineering | £555.65 | £ 552.46 | 0.58% |
| Demolition | £684.69 | £ 789.85 | -13.31% |
| Electrical | £704.25 | £ 682.37 | 3.21% |
| Equipment & Operator hire | £689.28 | £ 646.72 | 6.58% |
| Fit out by specialist trades | £651.64 | £ 668.59 | -2.54% |
| General Construction | £571.42 | £ 565.34 | 1.08% |
| Insulation | £819.50 | £ 729.77 | 12.30% |
| Joinery | £704.59 | £ 603.80 | 16.69% |
| Mechanical | £435.80 | £ 449.98 | -3.15% |
| Plastering | £513.15 | £ 456.49 | 12.41% |
| Plumbing | £639.54 | £ 619.47 | 3.24% |
| Roofing | £664.69 | £ 663.39 | 0.20% |
| Scaffolding | £429.93 | £ 410.17 | 4.82% |
| Shopfitting | £918.14 | £ 944.96 | -2.84% |
| Steel & Timber frame erect | £645.53 | £ 677.41 | -4.71% |
| Surfacing contractors | £639.68 | £ 632.15 | 1.19% |
| Average | £634.45 | £ 621.71 | 2.05% |
MIDLANDS
| Last Month | 3 months ago | % change | |
| Bricklaying | £420.02 | £399.08 | 5.25% |
| Civil Engineering | £660.25 | £643.16 | 2.66% |
| Demolition | £663.41 | £649.47 | 2.15% |
| Electrical | £649.56 | £651.11 | -0.24% |
| Equipment & Operator hire | £613.39 | £570.25 | 7.57% |
| Fit out by specialist trades | £669.51 | £583.88 | 14.67% |
| General Construction | £622.67 | £617.26 | 0.88% |
| Insulation | £691.00 | £644.90 | 7.15% |
| Joinery | £661.60 | £589.67 | 12.20% |
| Mechanical | £725.71 | £678.95 | 6.89% |
| Plastering | £613.43 | £577.29 | 6.26% |
| Plumbing | £763.96 | £657.39 | 16.21% |
| Roofing | £514.39 | £426.99 | 20.47% |
| Scaffolding | £544.15 | £602.64 | -9.71% |
| Shopfitting | £717.25 | £707.97 | 1.31% |
| Steel & Timber frame erect | £750.30 | £782.77 | -4.15% |
| Surfacing contractors | £716.20 | £640.00 | 11.91% |
| Average | £646.87 | £613.10 | 5.51% |
SOUTH EAST
| Last Month | 3 months ago | % change | |
| Bricklaying | £540.84 | £ 539.70 | 0.21% |
| Civil Engineering | £658.68 | £ 642.14 | 2.58% |
| Demolition | £572.04 | £ 512.22 | 11.68% |
| Electrical | £834.33 | £ 779.94 | 6.97% |
| Equipment & Operator hire | £793.73 | £ 742.26 | 6.93% |
| Fit out by specialist trades | £661.36 | £ 664.96 | -0.54% |
| General Construction | £615.68 | £ 595.69 | 3.36% |
| Insulation | £782.59 | £ 692.71 | 12.98% |
| Joinery | £707.24 | £ 746.84 | -5.30% |
| Mechanical | £688.48 | £ 795.51 | -13.45% |
| Plastering | £551.59 | £ 641.85 | -14.06% |
| Plumbing | £811.54 | £ 776.83 | 4.47% |
| Roofing | £563.34 | £ 669.48 | -15.85% |
| Scaffolding | £612.74 | £ 633.25 | -3.24% |
| Shopfitting | £964.69 | £ 865.28 | 11.49% |
| Steel & Timber frame erect | £574.98 | £ 620.18 | -7.29% |
| Surfacing contractors | £626.92 | £ 623.72 | 0.51% |
| Average | £680.05 | £ 678.97 | 0.16% |
SOUTH WEST
| Last Month | 3 months ago | % change | |
| Bricklaying | £482.75 | £ 556.03 | -13.18% |
| Civil Engineering | £571.66 | £ 563.91 | 1.37% |
| Demolition | £548.22 | £ 561.61 | -2.38% |
| Electrical | £603.42 | £ 721.20 | -16.33% |
| Equipment & Operator hire | £548.69 | £ 573.96 | -4.40% |
| Fit out by specialist trades | £659.73 | £ 780.17 | -15.44% |
| General Construction | £581.41 | £ 612.64 | -5.10% |
| Insulation | £645.21 | £ 625.62 | 3.13% |
| Joinery | £480.63 | £ 474.67 | 1.26% |
| Mechanical | £572.37 | £ 622.92 | -8.12% |
| Plastering | £544.66 | £ 595.49 | -8.54% |
| Plumbing | £550.19 | £ 600.28 | -8.34% |
| Roofing | £556.12 | £ 546.10 | 1.83% |
| Scaffolding | £535.49 | £ 491.76 | 8.89% |
| Shopfitting | £914.41 | £ 933.76 | -2.07% |
| Steel & Timber frame erect | £669.03 | £ 727.00 | -7.97% |
| Surfacing contractors | £497.26 | £ 526.28 | -5.51% |
| Average | £585.96 | £ 618.44 | -5.25% |
Hudson Contract’s ‘window on the construction industry’ gives you hard figures and data that is not available from any other source, with pay averages that reflect the amounts paid by a sample number of businesses – large and small – to specific trades over the twelve weeks to 30th September 2013.
To get the latest pay stats before anyone else, sign-up to Hudson Contract eNews below