21st April 2015 | Hudson Contract
Hudson Contract delivers the most accurate indications of pay trends across the construction industry, using payroll data for over 2,200 construction companies to publish the average pay for the full spectrum of 17 different trades across five regions.
Is political uncertainty hampering construction’s recovery? After several months of continuous increases, it looks as if earnings are beginning to level out again, with a mixed picture across the country this month.
None of the changes are enormously significant: the North-West leads the way with a 3% earnings increase across the board, while the South-East brings up the rear with a reduction of 1.5%.
“I think the lack of direction reflects the fact that this is the most uncertain election in decades,” says Hudson Contract Managing Director Ian Anfield. “Although looking beyond May, once the dust settles, regardless of which party – or parties – form the next government, there’s a general commitment to infrastructure and housing.
“This explains why the latest Markit/CIPS monthly survey is confident about the post-election era. Fifty-seven percent of respondents expect output to rise over the next twelve months – which is the highest indicator of optimism for the construction sector since February 2006.
“So I think what we’ve been seeing in the past few weeks is nothing more sinister than a blip. Just as many estate agents are reporting a pre-election slowdown, there’s also been a levelling off in our industry.”
Regional fluctuations
Back to this month’s Hudson Contract paystats… While it’s been a good month for bricklayers and surfacing contractors – who are up across all regions by 8% and 7% respectively – we are seeing distinct regional fluctuations.
For instance, looking at this month's winners and losers, equipment and operator hire feature in both categories – and in adjoining regions. (Can we expect to see a group of freelance operatives moving across the Pennines in the coming months? We’ll keep an eye on it!)
This month’s winners:
- Surfacing Contractors in the North-East: +21%
- Scaffolders in the North-West: +21%
- Equipment & Operator Hire in the North-East: +16%
And the losers:
- Roofers in the South-East: -14%
- Steel & Timber Frame Erectors in the South-West - 14%
- Equipment & Operator Hire in the North-West: -13%
In terms of cash, five groups of freelance builders – shopfitters in the South-East, North-West and South-West, plus surfacing contractors in the Midlands and electricians in the South-East – are all earning over £950 a week.
As for the ‘poor relations’, these are to be found in the North-West, where scaffolders have been earning £513 pw, while plasterers are getting by on weekly earnings of £464.
2014 v 2015: The picture is clear
Whilst the statistics are level over past three months, the annual picture is far more positive.
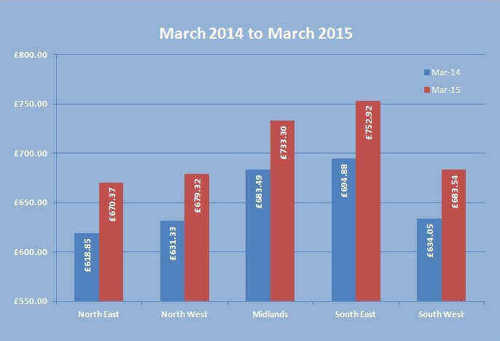
All five regions show significant growth of 7% to 8 % over the past twelve months, which equates to an average increase of about £51 a week. Joiners and roofers have done much better – in fact 100% better – with average weekly increases of over £100 in the same period.
NORTH EAST
| Last Month | 3 months ago | % change | |
| Bricklaying | £652.85 | £594.33 | 9.85% |
| Civil Engineering | £685.14 | £658.95 | 3.97% |
| Demolition | £399.74 | £429.49 | -6.93% |
| Electrical | £650.06 | £716.74 | -9.30% |
| Equipment & Operator hire | £787.20 | £679.13 | 15.91% |
| Fit out by specialist trades | £735.58 | £746.56 | -1.47% |
| General Construction | £737.35 | £729.71 | 1.05% |
| Insulation | £642.36 | £624.98 | 2.78% |
| Joinery | £744.81 | £760.72 | -2.09% |
| Mechanical | £683.19 | £682.21 | 0.14% |
| Plastering | £725.90 | £764.51 | -5.05% |
| Plumbing | £629.36 | £622.64 | 1.08% |
| Roofing | £661.18 | £699.57 | -5.49% |
| Scaffolding | £591.60 | £591.82 | -0.04% |
| Shopfitting | £645.46 | £675.36 | -4.43% |
| Steel & Timber frame erect | £730.79 | £721.69 | 1.26% |
| Surfacing contractors | £693.75 | £574.73 | 20.71% |
| Average | £670.37 | £663.13 | 1.09% |
NORTH WEST
| Last Month | 3 months ago | % change | |
| Bricklaying | £638.71 | £576.33 | 10.82% |
| Civil Engineering | £629.38 | £633.17 | -0.60% |
| Demolition | £774.03 | £808.14 | -4.22% |
| Electrical | £801.28 | £860.25 | -6.85% |
| Equipment & Operator hire | £673.70 | £774.54 | -13.02% |
| Fit out by specialist trades | £682.63 | £607.49 | 12.37% |
| General Construction | £765.71 | £700.18 | 9.36% |
| Insulation | £724.18 | £685.96 | 5.57% |
| Joinery | £692.06 | £714.78 | -3.18% |
| Mechanical | £559.44 | £513.51 | 8.94% |
| Plastering | £464.49 | £452.60 | 2.63% |
| Plumbing | £527.91 | £533.71 | -1.09% |
| Roofing | £913.14 | £845.03 | 8.06% |
| Scaffolding | £513.96 | £426.06 | 20.63% |
| Shopfitting | £926.47 | £887.89 | 4.35% |
| Steel & Timber frame erect | £652.25 | £594.12 | 9.78% |
| Surfacing contractors | £609.03 | £598.23 | 1.81% |
| Average | £679.32 | £659.53 | 3.00% |
MIDLANDS
| Last Month | 3 months ago | % change | |
| Bricklaying | £689.22 | £650.26 | 5.99% |
| Civil Engineering | £751.75 | £807.18 | -6.87% |
| Demolition | £788.11 | £814.34 | -3.22% |
| Electrical | £712.07 | £743.11 | -4.18% |
| Equipment & Operator hire | £626.73 | £690.65 | -9.26% |
| Fit out by specialist trades | £872.48 | £777.51 | 12.21% |
| General Construction | £711.23 | £730.48 | -2.64% |
| Insulation | £616.98 | £676.27 | -8.77% |
| Joinery | £762.13 | £675.35 | 12.85% |
| Mechanical | £750.69 | £749.69 | 0.13% |
| Plastering | £618.43 | £639.44 | -3.29% |
| Plumbing | £832.73 | £831.84 | 0.11% |
| Roofing | £713.99 | £685.20 | 4.20% |
| Scaffolding | £676.08 | £709.05 | -4.65% |
| Shopfitting | £826.24 | £853.85 | -3.23% |
| Steel & Timber frame erect | £614.46 | £605.09 | 1.55% |
| Surfacing contractors | £902.84 | £818.41 | 10.32% |
| Average | £733.30 | £732.81 | 0.07% |
SOUTH EAST
| Last Month | 3 months ago | % change | |
| Bricklaying | £706.35 | £669.41 | 5.52% |
| Civil Engineering | £733.27 | £754.72 | -2.84% |
| Demolition | £625.29 | £578.35 | 8.12% |
| Electrical | £952.15 | £931.30 | 2.24% |
| Equipment & Operator hire | £825.47 | £840.10 | -1.74% |
| Fit out by specialist trades | £702.99 | £743.46 | -5.44% |
| General Construction | £706.36 | £707.81 | -0.20% |
| Insulation | £772.18 | £800.72 | -3.56% |
| Joinery | £856.94 | £906.53 | -5.47% |
| Mechanical | £767.27 | £782.28 | -1.92% |
| Plastering | £659.62 | £680.08 | -3.01% |
| Plumbing | £845.44 | £929.75 | -9.07% |
| Roofing | £626.29 | £729.24 | -14.12% |
| Scaffolding | £750.36 | £761.95 | -1.52% |
| Shopfitting | £955.77 | £893.06 | 7.02% |
| Steel & Timber frame erect | £605.41 | £587.46 | 3.06% |
| Surfacing contractors | £708.53 | £698.80 | 1.39% |
| Average | £752.92 | £764.41 | -1.50% |
SOUTH WEST
| Last Month | 3 months ago | % change | |
| Bricklaying | £523.54 | £493.34 | 6.12% |
| Civil Engineering | £672.49 | £736.43 | -8.68% |
| Demolition | £594.08 | £587.93 | 1.05% |
| Electrical | £659.76 | £657.62 | 0.33% |
| Equipment & Operator hire | £595.19 | £564.91 | 5.36% |
| Fit out by specialist trades | £774.09 | £832.80 | -7.05% |
| General Construction | £635.46 | £659.34 | -3.62% |
| Insulation | £649.14 | £641.19 | 1.24% |
| Joinery | £741.98 | £641.19 | 15.72% |
| Mechanical | £651.51 | £589.38 | 10.54% |
| Plastering | £736.48 | £641.74 | 14.76% |
| Plumbing | £693.27 | £709.69 | -2.31% |
| Roofing | £738.93 | £744.07 | -0.69% |
| Scaffolding | £698.02 | £703.50 | -0.78% |
| Shopfitting | £932.28 | £842.98 | 10.59% |
| Steel & Timber frame erect | £723.14 | £836.13 | -13.51% |
| Surfacing contractors | £600.75 | £587.52 | 2.25% |
| Average | £683.54 | £674.69 | 1.31% |
Hudson Contract’s ‘window on the construction industry’ gives you hard figures and data that is not available from any other source, with pay averages that reflect the amounts paid by a sample number of businesses – large and small – to specific trades over the twelve weeks to 31st March 2015.